Debug UI
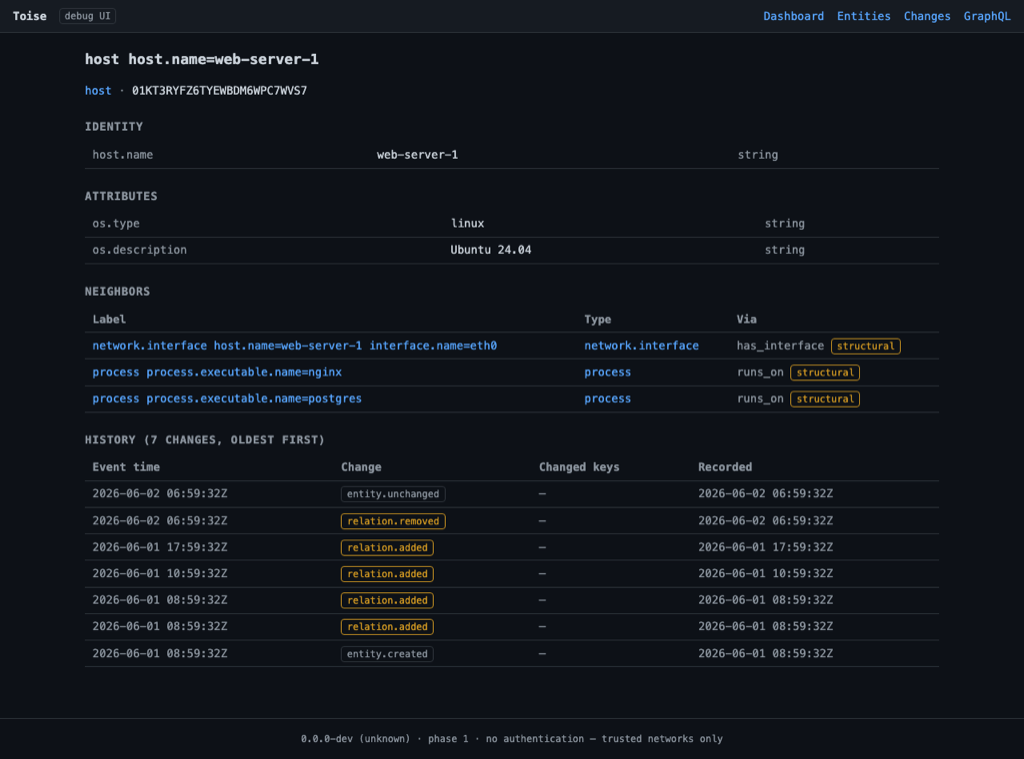
A minimal, zero-dependency browser view for operators to eyeball the graph without writing a query. It is served at the root of the HTTP listener:
It reads the same in-memory projection and event log as GraphQL and the MCP server, so it always shows the same world — it is a view, not a separate store.
What it is for
- A quick visual check that ingestion is working and entities are arriving.
- Browsing entities, their identifying and descriptive attributes, and the relations incident to them.
- Following edges by hand to understand the topology.
It is intentionally minimal and read-only. For programmatic access use
GraphQL; for natural-language questions use an assistant over
MCP; for an interactive GraphQL session use the playground at
http://127.0.0.1:8080/playground.
Human interfaces live at the edge
The debug UI is deliberately a thin operator aid, not the product. Toise's
core is the engine and its query surfaces; rich human visualisation belongs
at the edges
(ADR 0021).
The
graph-viz example
shows a live, GraphQL-subscriptions client rendering the graph in real time.