
The living, queryable map of your infrastructure.
An OpenTelemetry-native graph of your infrastructure — temporal by design, and built to be queried by your AI assistant.



A native MCP server your AI assistant drives on your behalf — it asks in plain language, Toise answers from the live, time-aware graph. No dashboards to pivot through.
Why Toise
Modern observability stacks have closed the visibility gap for applications, hosts, containers, and services. The living inventory of the underlying infrastructure — what exists, how it connects, and how it changes over time — remains a blind spot. Toise fills it: the missing inventory-and-topology brick of the open-source observability stack (OpenTelemetry, VictoriaMetrics, Grafana, Loki, Tempo), designed so an AI assistant can answer an operator's questions about it directly.
See it as a graph
Entities and the relationships between them — hosts, processes, interfaces, addresses, and the edges that link them — the way Toise holds them. Drag the nodes to rearrange them, and switch between a single host and a multi-site (on-prem + cloud) topology. Sketches, of course — the real graph is whatever your producers emit.
- host
- process / service
- database
- network device
- interface / address
Illustrative — colour is the entity type, each edge a typed relationship. Hover a node to focus its neighbours; drag to explore.
How it works
Toise is a pipeline, not a poller. Telemetry flows in as standard OpenTelemetry entity events; Toise records every change and serves the resulting graph to humans and machines alike.
Any OpenTelemetry producer
Host and network agents emit OTLP entity events. Toise runs no collectors and speaks no device protocols itself — emitting those events is the producers' job.
Durable event log
The OTLP receiver appends every observation to an append-only, event-sourced log — the system of record for what was seen and when.
Live, time-aware graph
A projection replays the log into an in-memory graph of entities and relationships — current state, with the full history one step away.
GraphQL & MCP
Read the same graph two ways: a GraphQL API for humans, dashboards, and tools — and a native MCP server your AI assistant drives directly.
What it does
Built for your AI assistant
Toise ships a native MCP server. Your LLM queries it on your behalf to answer questions about inventory, topology, dependencies, and what changed — in plain language.
OpenTelemetry-native ingestion
Toise ingests OTLP entity events from any OpenTelemetry producer (host and network agents). It runs no collectors of its own; it speaks the standard, not a proprietary protocol.
Temporal by construction
Event-sourced and bi-temporal. Not just the current state: what changed, why it differs from yesterday, and the full timeline of any entity.
Two ways to query the graph
One read model, two surfaces. A GraphQL API for people and tools, and a Model Context Protocol server with typed tools your AI assistant calls on your behalf.
# the same graph, queried directly
query {
  entity(id: "db-07") {
    label
    types
    relations { label type }
  }
  recentChanges(within: "1h") {
    edges { node { changeType entity { label } eventTime } }
  }
}
MCP tools your assistant can call
find_entitiesfilter by type and attributes
get_entityfetch one entity by id, with operator annotations
get_neighborstraverse relationships, depth-bounded
entity_historytimeline of an entity, with audit view
recent_changeswhat changed in a window, budgeted + digested
graph_diffnet difference between two instants, flapping surfaced
find_pathshortest path between two entities, or a true "not connected"
telemetry_keysthe join keys to this entity's metrics and logs
impact_ofblast radius of a failure, direction-aware per relation type
describe_typezoom on one entity type — observed shape and edges
describe_schemasummary + per-type counts to orient the model
annotate_entityattach operator notes as an overlay — the one write
Beyond the tools, the server exposes MCP resources (the live schema and a per-entity view, pinnable as context) and ready-made prompts for common operator workflows (investigate an incident, blast radius, explain an entity).
- "What changed in the network in the last hour?"
- "What is different now compared to this morning — and what flapped?"
- "If leaf-sw-3 goes down, what loses connectivity?"
- "Show db-07's dependencies as they were last Tuesday."
- "What did we know about this host at 09:00 — not what we know now?"
Or just look at it
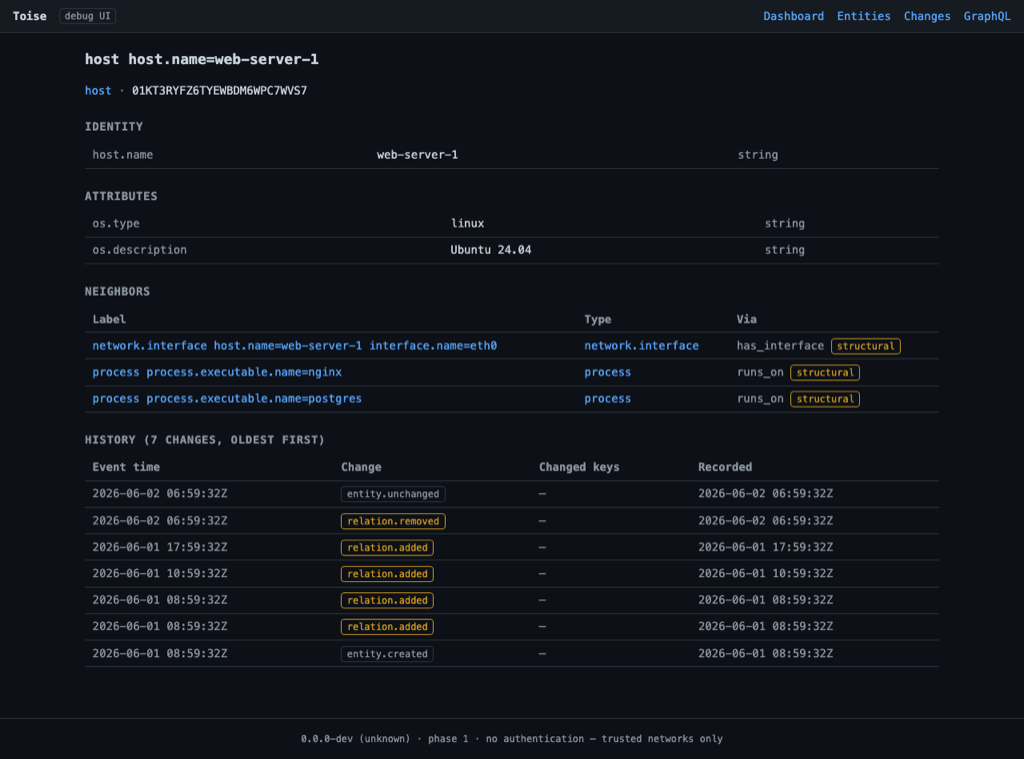
Sometimes you don't want a query or an assistant — you want to see the graph. Toise ships a built-in, zero-dependency debug UI to inspect an entity, its neighbors, and its full history directly. It's a developer aid, not a dashboard product — reading the same graph that GraphQL and MCP do.
Built temporal, not snapshot
Two timelines, on purpose
Every event records both when it happened (event time) and when Toise learned it (recorded time). Ask for the reality view — “how was it last Tuesday?” — or the audit view — “what did we know at 09:00?” Bi-temporal by construction.
Stable identity through change
An entity keeps one logical identity even when its identifying attributes change — a renamed host stays the same host on its timeline. A content hash handles lookup and idempotency, so re-observations never fork the graph.
Roadmap
High-level direction. Dates are targets, not commitments — they shift as the design firms up and as we learn from early deployments.
-
Foundations done
Event-sourced graph store, an OpenTelemetry-aligned entity model, OTLP ingestion, real-time subscriptions, the GraphQL + MCP read surfaces, a debug UI, and a public demo scenario.
-
Production-readiness & multi-tenancy done
Bearer-token auth with per-tenant authorization, TLS, multi-tenant isolation, operational endpoints and metrics, retention and snapshots, plus release binaries and a Docker image.
-
Time travel & the producer SDK done
As-of event-time queries across MCP and GraphQL, impact analysis, and the first public producer SDK with a conformance kit.
-
Integration & stability now
Operator annotations (a
get_entityoverlay and the first GraphQL mutation), MCP resources and prompts, read-only and ingest-only token roles, a conformance CLI plus a producer directory, and a pinned, documented API surface. -
Toward 1.0 next
A broader ecosystem of OpenTelemetry producers, more API stabilisation, and a release candidate.
-
Beyond
Federation across sites, richer graph-query semantics, and a wider integration ecosystem.
See the full roadmap for detail.
FAQ
Is Toise ready for production?
Toise is pre-1.0, so the data model and APIs can still change between releases — but it is well past a prototype: bearer-token auth with per-tenant authorization, TLS, multi-tenant isolation, operational endpoints, release binaries and a Docker image all ship today. It binds to localhost by default; auth and TLS are opt-in for exposed deployments. Follow the roadmap to track the path to 1.0.
Does Toise collect data from my devices?
No. Toise ingests OpenTelemetry entity events from any OTLP producer; it runs no collectors and speaks no device protocols itself. Emitting those events — from hosts, network gear, or cloud APIs — is the producers' job.
How is this different from a CMDB?
A CMDB is usually hand-curated and point-in-time. Toise is event-sourced and bi-temporal: it's populated from telemetry, and you can query any past state and exactly what changed — not just the present.
What is MCP?
The Model Context Protocol — an open standard that lets an AI assistant call tools. Toise ships a native MCP server (on the official Go SDK) over HTTP and stdio, so assistants like Claude Desktop can read the graph on your behalf.
Is Toise tied to a particular agent or vendor?
No. Any OpenTelemetry producer works. senhub-agent is one example among others — Toise speaks the standard, not a proprietary protocol.
Where does it fit in the observability stack?
It's the missing inventory-and-topology brick alongside OpenTelemetry, VictoriaMetrics, Grafana, Loki, and Tempo — the live map of what exists and how it connects, over time.
Status
Toise is alpha and pre-1.0. The engine, OTLP ingestion, GraphQL and MCP surfaces, auth, and multi-tenancy are in place and exercised in real deployments, but the data model and APIs can still change between releases — expect breaking changes until 1.0. Follow the project on GitHub or read the roadmap to see where we're heading.
Follow along
Toise is built in the open. The fastest way to support it is to star the repository — it's the signal that tells us the direction resonates. Watch the roadmap to see what's landing next, or open an issue to shape it.
Want this operated at scale?
Toise is built and maintained by Sensor Factory, who design and run modern observability for mid-market and enterprise teams. If you'd like help putting an AI-queryable infrastructure graph into production, let's talk.